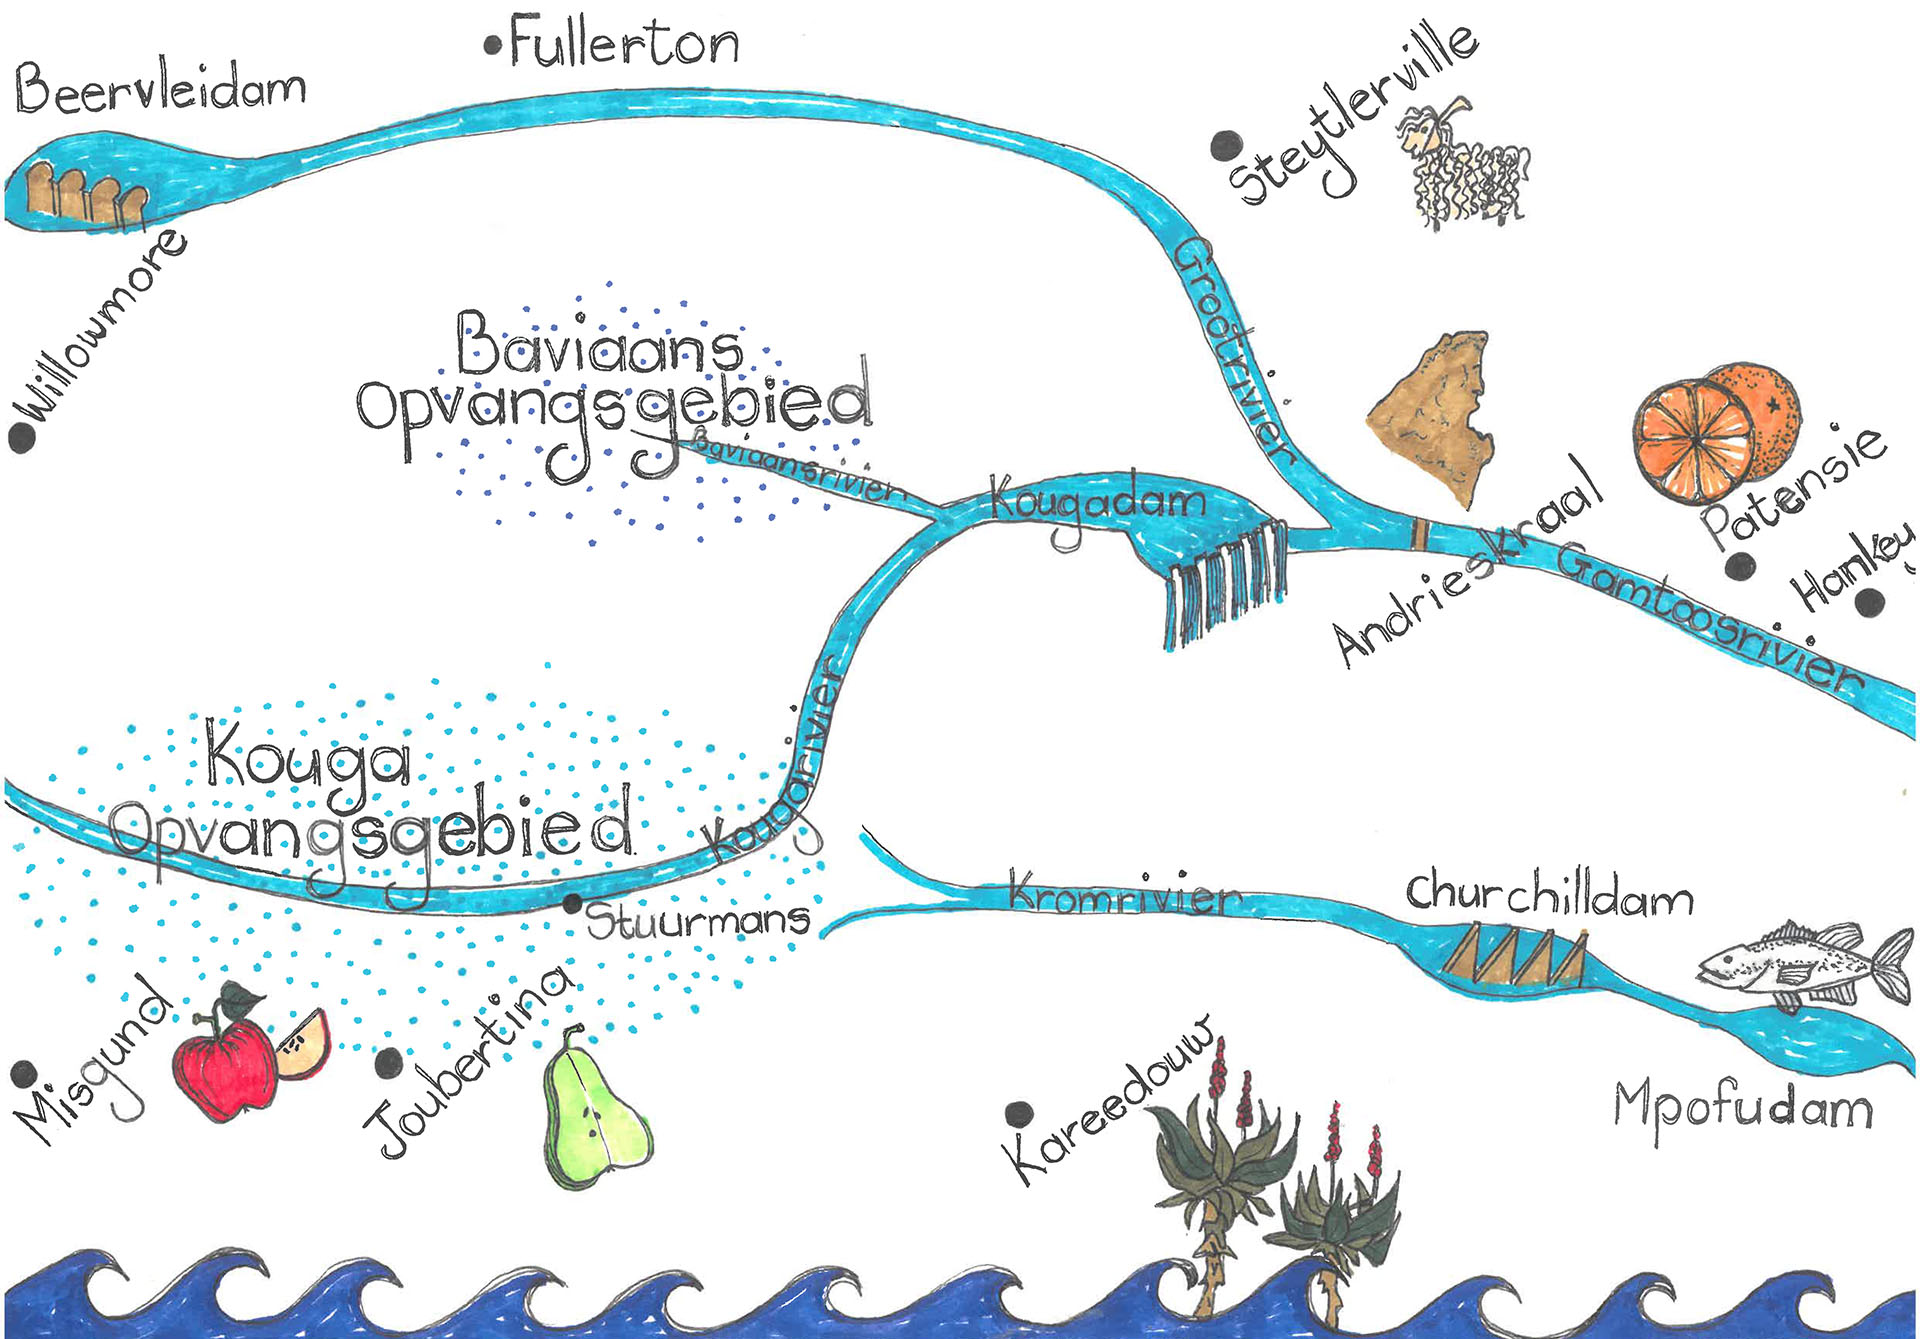
On the map below, you will see that the dam’s catchment areas are in the Langkloof and Baviaanskloof areas to the west, and that heavy rain in the Kouga region below the dam will not affect its levels.
Construction on the Kouga Dam, formerly known as the Paul Sauer Dam, began in 1957, and it was officially completed and commissioned in 1969.
Kouga Dam was designed by Piet Nutt, an engineer with the former Department of Water Affairs. The labour was provided by a prison labour camp on the site.
36 times from 1971 to present day.
| Year | Month | Highest Reading % | Overflow m/s | m/hr |
| 1971 | 31 Jul | 101,45 | 30 | 108000 |
| 1971 | 22 Aug | 115,18 | 1360 | 4896000 |
| 1974 | 2 Apr | 101,50 | 33 | 118800 |
| 1974 | 24 Aug | 105,72 | 289 | 1040400 |
| 1975 | 14 Sept | 101,84 | 45 | 162000 |
| 1976 | 3 Apr | 100,34 | 3 | 10800 |
| 1976 | 7 Oct | 101,45 | 30 | 108000 |
| 1977 | 11 May | 102,28 | 65 | 234000 |
| 1979 | 22 Aug | 110,06 | 711 | 2559600 |
| 1981 | 26 Mar | 111,04 | 826 | 2973600 |
| 1981 | 30 May | 117,92 | 1762 | 6343200 |
| 1983 | 26 Jul | 117,03 | 1627 | 5857200 |
| 1986 | 3 Nov | 100,51 | 9 | 32400 |
| 1993 | 25 Sept | 106,48 | 439 | 1580400 |
| 1993 | 1 Oct | 101,21 | 33 | 118800 |
| 1995 | 28 Dec | 101,21 | 33 | 118800 |
| 1996 | 22 Nov | 120,74 | 2425 | 8729640 |
| 1996 | 31 Dec | 102,87 | 125 | 450000 |
| 1997 | 5 Apr | 101,82 | 62 | 223200 |
| 1997 | 29 May | 101,73 | 58 | 208800 |
| 1997 | 11 Aug | 100,51 | 9 | 32400 |
| 2000 | 29 Mar | 101,65 | 53 | 190800 |
| 2000 | 22 Nov | 100,64 | 13 | 46800 |
| 2001 | 30 Sept | 100,43 | 7 | 25200 |
| 2002 | 12 Sept | 103,36 | 152 | 547200 |
| 2003 | 13 Jun | 100,45 | 7 | 25200 |
| 2006 | 4 Aug | 107,61 | 563 | 2026800 |
| 2007 | 28 May | 100,69 | 2,1 | 7560 |
| 2007 | 24 Nov | 109,78 | 828 | 2980800 |
| 2011 | 12 Jun | 102,14 | 76,28 | 274608 |
| 2012 | 15 Jul | 107,88 | 456,3 | 1642680 |
| 2013 | 1 Nov | 101,74 | 55,42 | 199512 |
| 2015 | 2 Sept | 107,2 | 477,06 | 1717416 |
| 2023 | 30 Sept | 101,56 | 46,95 | 169020 |
| 2024 | 10 Jun | 100,89 | 20 | 72000 |
| 2024 | 30 Oct | 103,31 | 149,09 | 536724 |
8 December 2024. It spilled for 42 consecutive days (at 100% or more) from 28 October to 8 December 2024.
The highest reading recorded to date was on 22 November 1996, when the dam was 120.74% full, with water flowing over the dam wall at a rate of 2 425 m/s or 8 729 640 m/hr.
The geography of the landscape makes it very difficult to build a pipeline, and the resulting costs would be too high.
The dam wall would first need to be strengthened before it could be raised, which would be an extremely expensive process.
The water quality is not up to standard, and is sometimes not even suitable for irrigation. It would negatively impact and reduce the overall quality of the dam water.
The dam level must remain high to generate electricity effectively. Power is generated with the release of water. If there have been good rains in the catchment area, then not much water is released, so it is not economically viable.
As a result of the geography of the area, it was decided that a double-curvature arch construction would create a stronger dam wall than the gravity wall option.
The dam falls within the Baviaanskloof Conservation Area. The area is also unsafe for these activities.